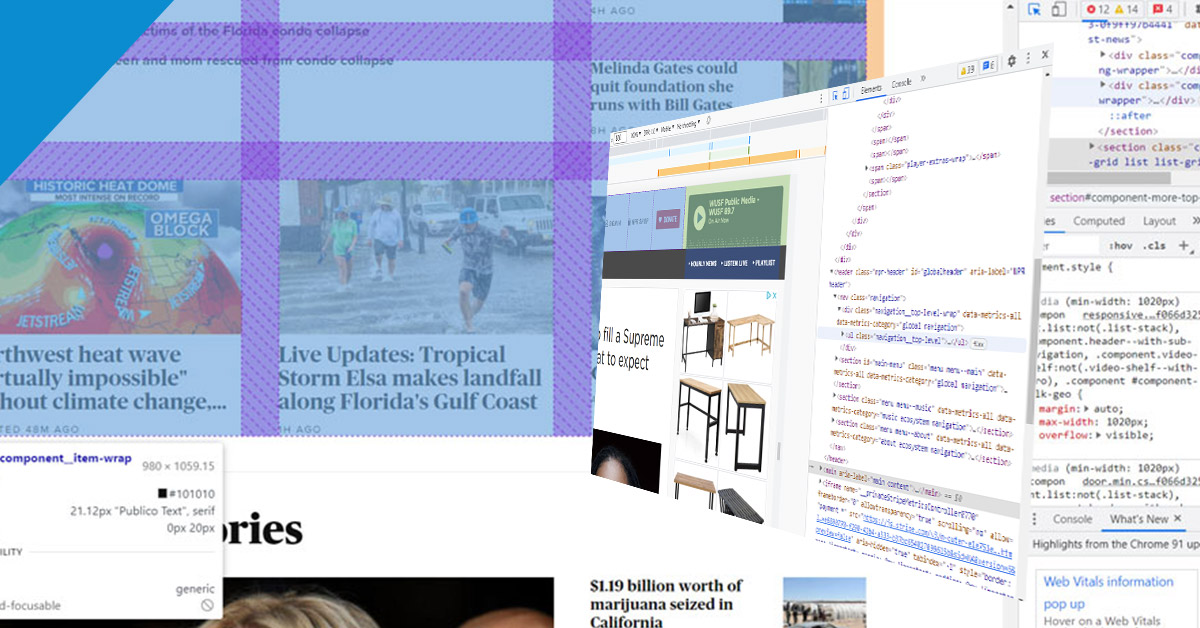
Using web developer and inspector tools
Inspect is also an incredibly valuable tool for those learning web development. Instead of viewing plain source code, use inspect element to interact with the page and see how each line of code maps to an element or style. By better understanding what constitutes the typical web page, you can communicate effectively with developers in the case of an error, or if you want to make a change.

Inspect may be a “developer tool,” but you don’t need to write any code or install any additional software to use it. You can do everything I’ve described right inside your browser — let’s learn how.
How To Inspect Elements
Every modern web browser has a native tool for inspecting elements. Here, I’ll explain how to use the inspect tool on the in three desktop web browsers: Google Chrome, Apple’s Safari, and Mozilla Firefox.
How To Inspect Elements in Firefox
To open the Firefox Inspector, you can:
The Firefox inspector appears along the bottom of the window by default. To change its position, select the three-dots icon in the top right corner of the inspector, then choose an alternative display option.
the inspect element tool in the firefox browser
Firefox’s inspector panel is comparable in features to Chrome’s and Safari’s. The HTML source code indicates the corresponding page element with color codes — content is blue, padding is purple, and margins are yellow:
gif of different page regions highlighted with the firefox inspect element tool
Plus, you can find code by selecting elements on the page — to enter selection mode, click the cursor icon in the top left corner:
the select element button in the firefox inspect element tool
Click any page element to reveal its source in the inspect panel.
To modify or delete a page element, select its code in the inspector. Then, either double-click to change the text, or right-click and choose Edit as HTML or Create New Node to add code. Or simply delete the code and see the resulting changes on the page.

the firefox inspect element text editor
the hubspot homepage with a new heading element added with firefox inspect element tool
To toggle the styling of an element, use the Filter Styles region at the bottom of the inspect panel. Uncheck the box next to a CSS declaration to deactivate it (or write in new code yourself):
gif of heading text changing size with the firefox inspect element tool
Finally, Firefox’s tools also come with a mobile preview option. To use it, click the Responsive Design Mode icon in the top right corner of the panel:
the mobile view button in firefox devloper tools
Responsive Design Mode lets you choose from several preset screen resolutions or set your own, and you can also toggle connection speed and device pixel ratio:
the responsive design editor in firefox inspect element tool
Get a Closer Look With Inspect
Once you learn the basics of your browser’s inspect tool, you might realize just how much information about your favorite websites is publicly available. With a few clicks, you can explore how exactly web pages are built, what styles they use, how they optimize for search engines, how they format on mobile screens, and a lot more.

For some, inspect is just a fun curiosity. For others, it’s a key asset for learning how other competing sites work. Whoever you are, it’s a great skill to have, and can provide insights beyond viewing the web page itself.

More about mobile heregfdgkldfkl glgfdgfdglfdshgfssdgl

fkjfdsafSDFkadsfadsfk.fkmdgfgkfdsgkfsdagfdskgfdssgkg
